The graph below shows the percentage of students enrolled in the College of Engineering at State University. Use the graph to answer the question.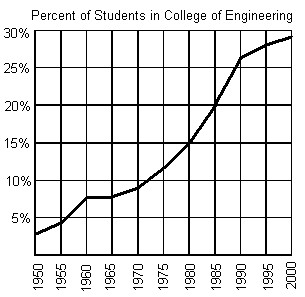 Does the graph represent a function?
A. yes
B. no
Answer: A
Mathematics
You might also like to view...
Use the line graph to answer the question.The line graph shows the 2001 sales data for the Big "D" company. 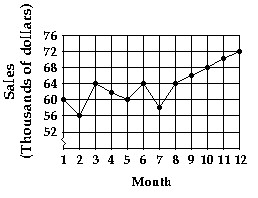 In the first six months, which month(s) had the highest sales?
A. Month 12 B. Month 3, Month 6 C. Month 6 D. Month 1, Month 3
Mathematics
Sketch the graph of the polar equation. Identify the curve.r = 6 + 5 sin ?
A. limaçon not dimpled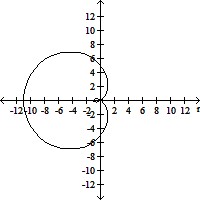
B. dimpled limaçon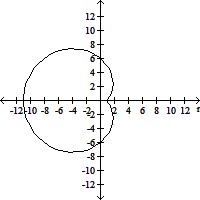
C. dimpled limaçon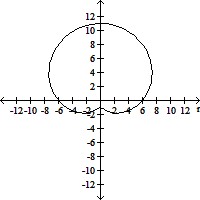
D. inner loop limaçon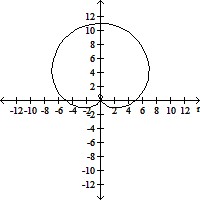
Mathematics
Provide an appropriate response.Cost plus markup is equal to the selling price.
A. True B. False
Mathematics
Find the x- and y-intercepts of f.f(x) = (x + 1)(x - 9)(x - 1)2
A. x-intercepts: -1, 1, 9; y-intercept: 9 B. x-intercepts: -1, 1, -9; y-intercept: 9 C. x-intercepts: -1, 1, -9; y-intercept: -9 D. x-intercepts: -1, 1, 9; y-intercept: -9
Mathematics