The data in the figure below represents the annual salaries of 200 professional musicians.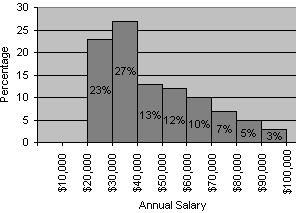
Give the length of of each class interval in the bar graph (in dollars).
A. $90,000
B. $20,000
C. $5
D. $10,000
E. $9999
Answer: D
Mathematics
You might also like to view...
Evaluate the expression.3-2
A. -9
B. 9
C. 
D. 
Mathematics
Evaluate the integral. 
A. 
B. 0
C. 
D. 
Mathematics
Solve the problem.A rock falls from a tower that is 368 ft high. As it is falling, its height is given by the formula  How many seconds will it take for the rock to hit the ground (h=0)?
A. 4.8 s B. 18.8 s C. 8464 s D. 19.2 s
Mathematics
Explain the behavior of the graph of f(x) as it approaches its vertical asymptote.f(x) = 
A. Approaches ? from the left, approaches -? from the right B. Approaches -? from the left and the right C. Approaches -? from the left, approaches ? from the right D. Approaches ? from the left and the right
Mathematics