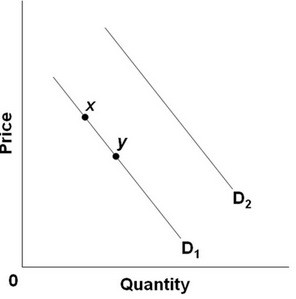
 Refer to the above diagram for good X. A shift from D2 to D1 would best be explained by:
A. an increase in the price of good X.
B. an increase in the price of a complementary good Y.
C. an increase in the price of a substitute good Z.
D. a decrease in the price of good X.
Answer: B
You might also like to view...
If a firm is an oligopolist, which is NOT true?
A) It must pay attention to other firms' prices. B) It is one of a relatively small number of firms dominating its industry. C) It can sell all the units it wants at the going market price. D) It is engaged in a strategic game.
Households
a. own and sell resources b. play a very minor role in the economy c. supply goods and services d. are the largest purchasers of resources e. none of the above
An increase in interest rates affects aggregate demand by
A. Shifting the aggregate demand curve to the right, increasing real GDP and lowering the price level B. Shifting the aggregate demand curve to the left, reducing real GDP and lowering the price level C. Shifting the aggregate supply curve to the left, decreasing real GDP and increasing the price level
Refer to the table shown. The marginal product of the sixth worker is:Number of workersTotal output142103184285356417458489501049
A. 6. B. 7. C. 8. D. 9.