The line graph shows the costs of a 30-second television spot (in thousands of dollars) during the Super Bowl from 1995 to 2005.

Approximate the percent increase in the cost of a 30-second spot from the Super Bowl in 2000 to the Super Bowl in 2005.
A. 5%
B. 14%
C. 2%
D. 9%
E. 18%
Answer: D
You might also like to view...
Perform the indicated operation involving cylindrical coordinates.Write the equation r2 - z2 = 36 in rectangular coordinates.
A. x2 + y2 = -36 B. x2 + y2 + z2 = 36 C. x2 + y2 = 36 D. x2 + y2 - z2 = 36
Find the real roots of the equation by factoring.
?
 ?
?
A. 
B. 
C. 
D. 
E. 
Rewrite the statement so the inequality symbol points in the opposite direction.8.43 ? 6.93
A. 8.43 ? 6.93 B. 6.93 ? 8.43 C. 6.93 ? 8.43 D. 8.43 < 6.93
Solve the problem.The average cost per tape, in dollars, for a company to produce x sports videotapes is given by the functionA(x) =  for x > 0
Graph the function on the interval (0, ?) and complete the following:A(x) ?
for x > 0
Graph the function on the interval (0, ?) and complete the following:A(x) ?  as x ? ?.
A. 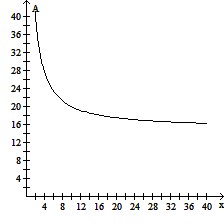
A(x) ? 0 as x ? ?.
B. 
A(x) ? 1 as x ? ?.
C. 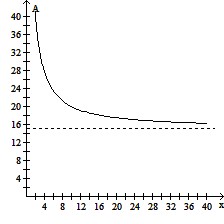
A(x) ? 15 as x ? ?.
D. 
A(x) ? 20 as x ? ?.