The following diagram presents a circular-flow model of a simple economy. The outer set of arrows (shown in green) shows the flow of dollars, and the inner set of arrows (shown in red) shows the corresponding flow of inputs and outputs. Which of the following is true regarding this economic model?
a) Because it does not take into account the role of government, the circular-flow diagram is useless for the purposes of modeling how dollars and resources move throughout an economy.
b) Because it does not take into account international trade, the circular-flow diagram is useless for the purposes of modeling how dollars and resources move throughout an economy.
c) While simple, the circular-flow diagram can still be useful for the purposes of modeling how dollars and resources move throughout an economy.
d) Because, in reality, the economy is very large, the simplicity of the circular-flow diagram makes it useless for the purposes of modeling how dollars and resources move throughout an economy.
Ans: c) While simple, the circular-flow diagram can still be useful for the purposes of modeling how dollars and resources move throughout an economy.
You might also like to view...
The calculation of the final goods and services sold in an economy would NOT include
A) the purchase of a lawnmower by a household. B) General Motors' purchases of tires for new automobiles. C) Ford Motor Company's purchase of a new industrial robot to be used to produce cars. D) the purchase of a service by a household.
Figure 3-7
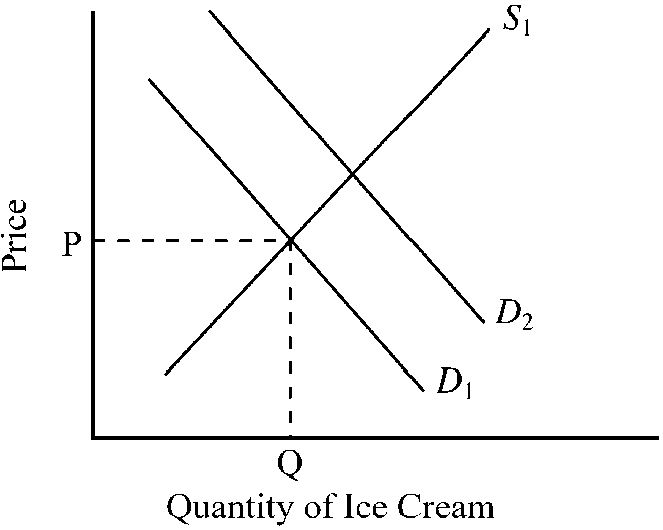
In , suppose D1 and S1 indicate the initial conditions in the market for ice cream. Which of the following changes would tend to cause the shift from D1 to D2 in the market for ice cream?
a.
a decrease in the price of sugar, an ingredient used to produce ice cream
b.
an increase in the price of frozen yogurt, a substitute for ice cream
c.
abnormally cold weather that decreased consumer desire for ice cream
d.
an increase in the price of milk, an ingredient used to produce ice cream
The cost savings from outsourcing often lead to ________ for consumers and ________ for the outsourcing company.
A. lower prices; less output B. lower prices; more output C. higher prices; less output D. higher prices; more output
Refer to the diagram. The movement down the production possibilities curve from point A to point E suggests that the production of:
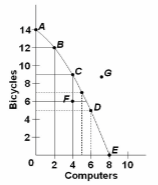
A. computers, but not bicycles, is subject to increasing opportunity costs.
B. bicycles, but not computers, is subject to increasing opportunity costs.
C. both bicycles and computers is subject to constant opportunity costs.
D. both bicycles and computers is subject to increasing opportunity costs.