Solve the problem.The line graph shows the cost of inflation. What cost $10,000 in 1980 would cost the amount shown by the graph in subsequent years. 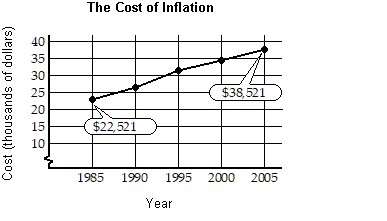 Below are two mathematical models for the data shown in the graph. In each formula, C represents the cost x years after 1985 of what cost $10,000 in 1980. Model 1: C = 798x + 22,521 Model 2: C = -x2 + 820x + 23,017Which model is a better description for the cost in 2005 of what cost $10,000 in 1980?
A. Model 1
B. Model 2
Answer: A
You might also like to view...
Solve the problem.Find the measure of an angle whose supplement is 6 times the measure of its complement.
A. 30° B. 15° C. 36° D. 72°
157.08 cubic millimeters of material was removed by drilling the blind hole shown in the illustration. Find the depth of the hole.
(The volume of a cylinder is given by  )
)
?

?

?
A. 10 millimeters
B. 5 millimeters
C. 1 millimeters
D. 8 millimeters
E. 16 millimeters
Solve. Write the fraction in simplest form.Marty jogged  of a mile from home and then rested. Then he continued jogging another
  of a mile until he discovered his watch had fallen off. He walked back along the same path for
  of a mile until he found his watch. Find how far he was from his starting point.
A.  mi
mi
B.  mi
mi
C.  mi
mi
D.  mi
mi
Simplify the decimal expression.61.6671 - 19.6684
A. 42.9987 B. 41.9887 C. 41.8987 D. 41.9987