Analyze the following code:
```
public class Test {
public static void main(String[] args)
throws MyException {
System.out.println("Welcome to Java");
}
}
class MyException extends Error {
}```
a. You should not declare a class that extends Error, because Error raises a fatal error that terminates the program.
b. You cannot declare an exception in the main method.
c. You declared an exception in the main method, but you did not throw it.
d. The program has a compile error.
a When an exception of Error type occurs, your program would terminate. Therefore, you should not declare an exception that extends Error.
You might also like to view...
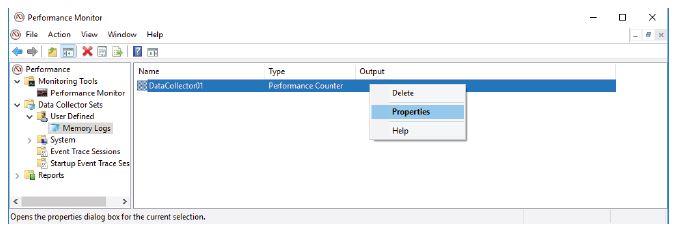
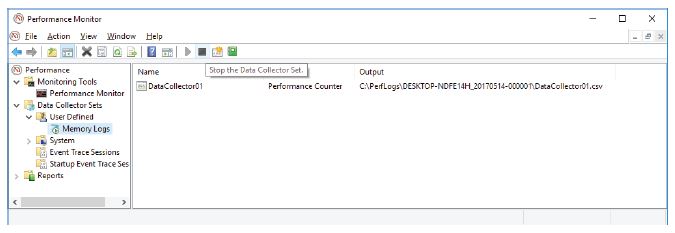
What change do you notice for the Memory Logs icon?
Configuring Administrative Tools
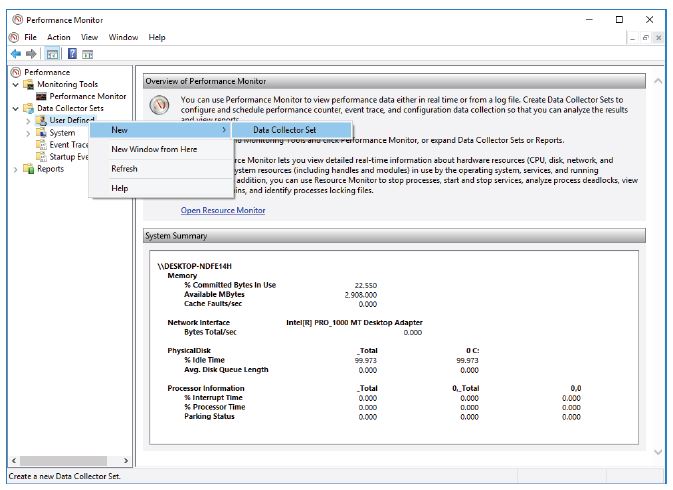
a. Click Control Panel > Administrative Tools > Performance Monitor. The Performance Monitor window opens. Expand Data Collector Sets. Right-click User Defined, and select New > Data Collector Set.
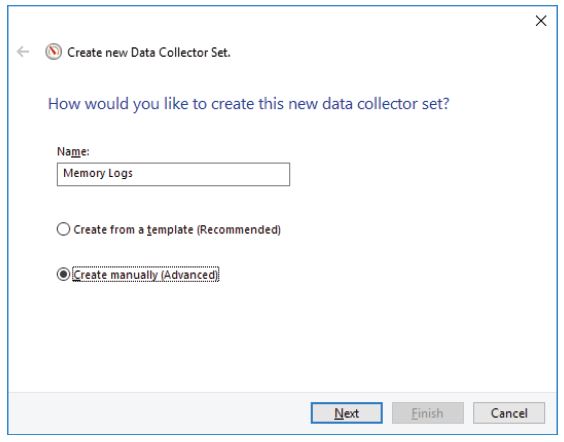
b. The Create new Data Collector Set window opens. In the Name field, type Memory Logs. Select the Create manually (Advanced) radio button, and click Next.
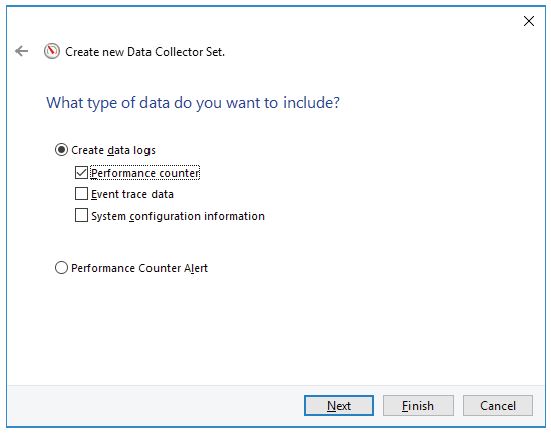
c. The What type of data do you want to include? screen opens. Check the Performance counter box then click Next.
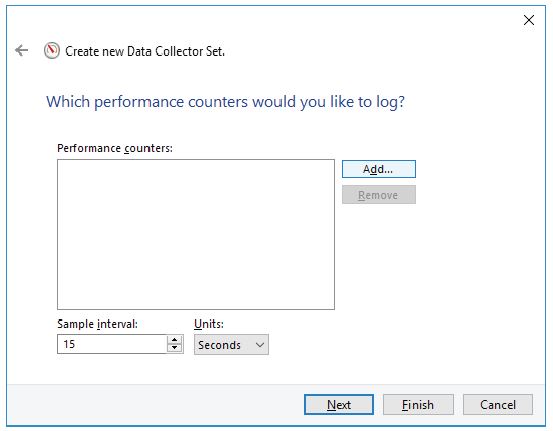
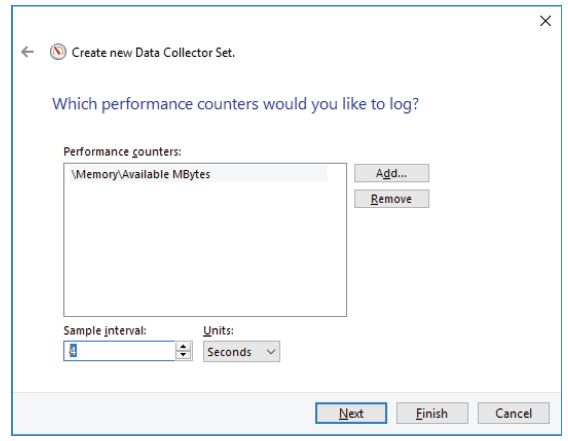
d. The Which performance counters would you like to log? screen opens. Click Add.
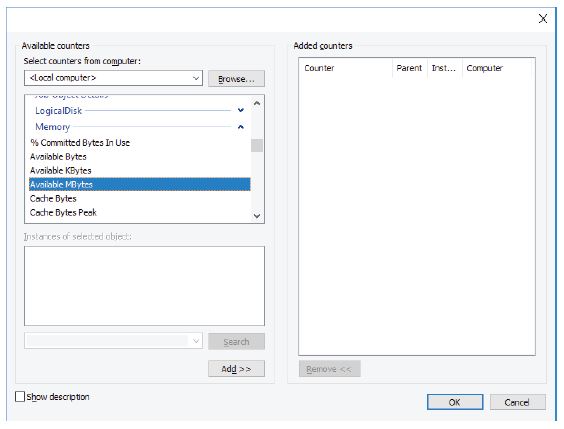
e. From the list of available counters, locate and expand Memory. Select Available MBytes and click Add>>.
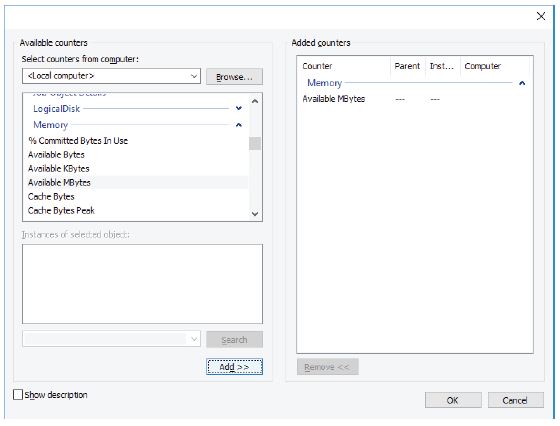
f. You should see the Available MBytes counter added in the right pane. Click OK.
g. Set the Sample interval field to 4 seconds. Click Next.
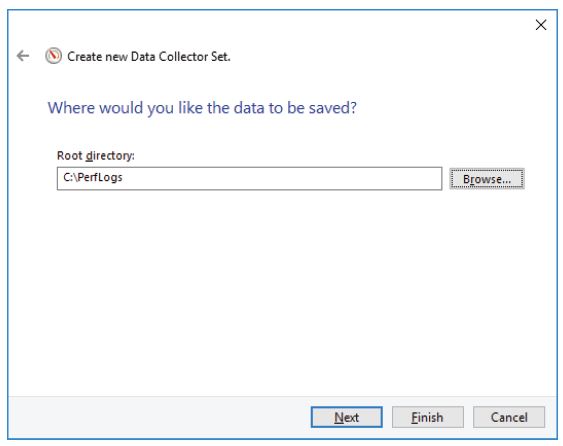
h. In the Where would you like the data to be saved? screen, click Browse.
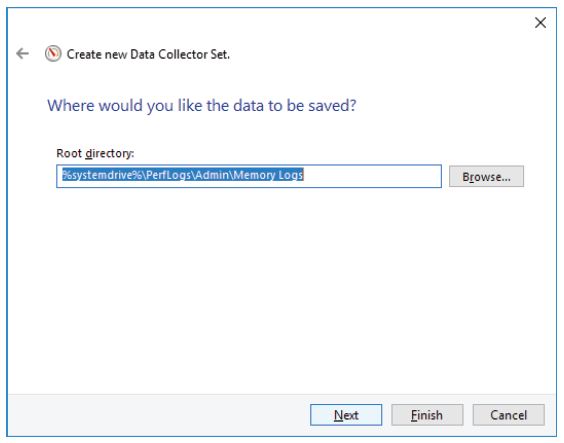
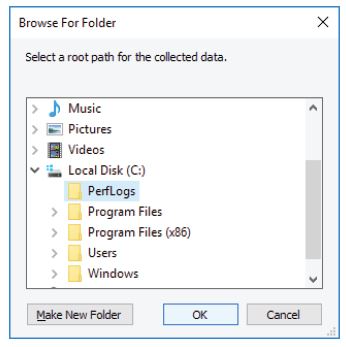
i. The Browse For Folder window opens. Select your (C:) drive, which is Local Disk (C:) in the figure on the next page. Select PerfLogs and click OK.
j. The Where would you like the data to be saved? window opens with the directory information that you selected in the previous step. Click Next.
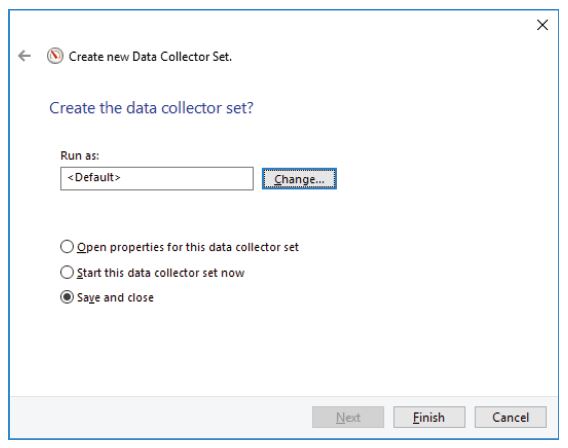
k. The Create the data collector set? screen opens. Click Finish.
l. Expand User Defined, and select Memory Logs. Right-click Data Collector01and select Properties.
m. The DataCollector01 Properties window opens. Change the Log format: field to Comma Separated.
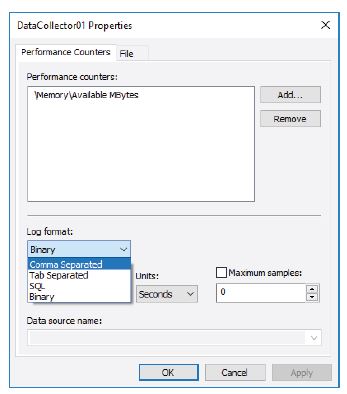
n. Click the File tab.
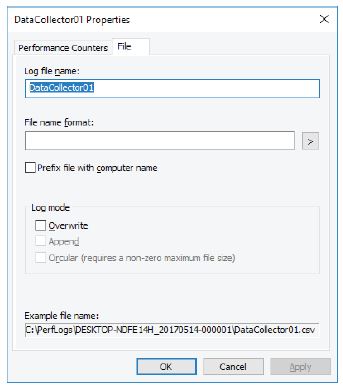
o. Click OK.
p. Select the Memory Logs icon in the left pane of the Performance Monitor window. Click the green arrow icon to start the data collection set. Notice a green arrow is placed on top of the Memory Logs icon.
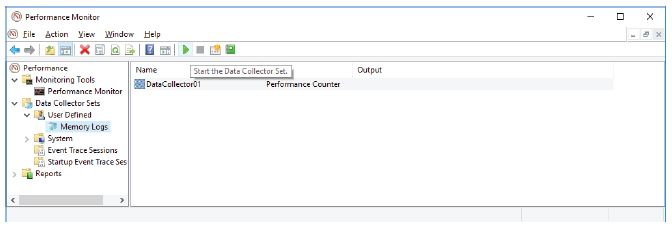
q. To force the computer to use some of the available memory, open and close a browser.
r. Click the black square icon to stop the data collection set.
The Many Fields tool creates a form that lists all the fields in a datasheet format, but using a style that is similar to the form created by the Form tool.
Answer the following statement true (T) or false (F)
A(n) ____________________ address is a number that uniquely identifies the location of each computer or device connected to the Internet.
Fill in the blank(s) with the appropriate word(s).
A city or town likely uses a(n) ______.
A. LAN B. MAN C. WAN D. PAN