Determine whether each curve represents a graph of a function.
 figure 1.png)
(a) no,
(b) no,
(c) yes,
(d) yes
You might also like to view...
Count the number of items asked for in the problem.Squares (of any size)
A. 12 B. 13 C. 18 D. 17
A town is experiencing a growth pattern of 6% per year in its population P; that is dP/dt = 0.06P, where P is the population of the town and t is the time, in years, from 2000.
(a) Given that the town’s population in 2000 was 8500, find the solution of the equation assuming P0 = 8500 and k = 0.06. (b) What will the population be in 2015? (c) What is the doubling time of the population?
Sketch the graph of the given equation over the interval [-2?, 2?].y =  cos
cos 

A. 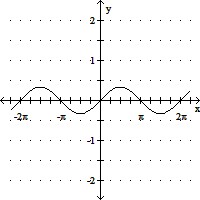
B. 
C. 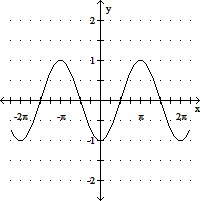
D. 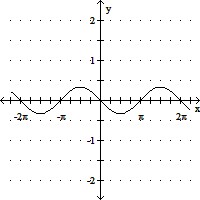
Solve the system of equations by graphing. If the system is inconsistent or the equations are dependent, say so. x -
x -  y = 5
y = 5 x +
x +  y = 12
A. {(4, 3)} B. {(3, 4)} C. {(3, 1)} D. {(4, -3)}