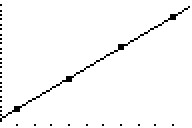
Plot the data from the following table and then add the graph of  to the plot.
x 2 5 8 11 y 7.39 13.81 20.23 26.65
What will be an ideal response?

?
The horizontal span is 0 to 12, and the vertical span is 0 to 30.
You might also like to view...
Solve.(2m - 5)2 = -81
A. No real solution B. 2, -7 C. 4, -14 D. 14, -4
A delivery truck must deliver packages to 6 different store locations (A, B, C, D, E, and F). The trip must start and end at C. The graph below shows the distances (in miles) between locations. We want to minimize the total distance traveled.
 The repetitive nearest-neighbor tour starting with vertex C is given by:
A. C, A, B, D, F, E, C. B. C, B, D, F, E, A, C. C. C, A, E, F, B, D, C. D. C, D, E, F, A, B, C. E. none of these
Provide an appropriate response.What is the value of  for any values of the variables?
A. 0 B. -1 C. 1 D. Undefined
Solve the problem.A club elects a president, vice-president, and secretary-treasurer. How many sets of officers are possible if there are 15 members and any member can be elected to each position? No person can hold more than one office.
A. 32,760 B. 910 C. 2730 D. 1365