Draw a graph illustrating a competitive firm in short-run equilibrium that is earning an economic profit. Be sure to label all curves and axes correctly.
What will be an ideal response?
The diagram should look like Figure 10-2 in the text. Note that price must be higher than the minimum of average cost.
You might also like to view...
Use the figure below to answer the following question. The equilibrium point in the market is the point at which the S and D curves intersect.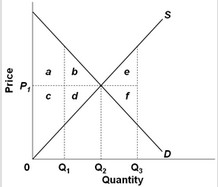 Assuming equilibrium price P1, consumer surplus is represented by areas
A. a + c. B. a + b + c + d. C. c + d. D. a + b.
Holding everything else constant, if total factor productivity increases, the debt-to-GDP ratio will ________, and if the labor force growth rate increases, the debt-to-GDP ratio will ________
A) increase; increase B) increase; decrease C) decrease; increase D) decrease; decrease
If the price elasticity of demand for a good is 0.25, then a 20 percent decrease in price results in a
a. 0.0625 percent increase in the quantity demanded. b. 4 percent increase in the quantity demanded c. 5 percent increase in the quantity demanded. d. 80 percent increase in the quantity demanded.
If a firm's output equals 10, product price equals $5.00, TFC = $8.00, and TVC = $60.00, then the firm's profit would equal
a. $.80 b. $1.80 c. $80.00 d. –$16.80 e. –$18.00