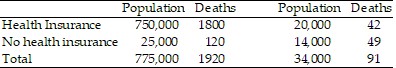
Give an appropriate response.The following table shows the deaths due to the same disease in two cities. Compute the death rates in each city for those with health insurance, those without health insurance, and all residents. Explain the apparent inconsistency in these results. 
What will be an ideal response?

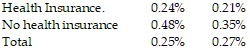
The rate for both those with health insurance and those without health insurance is higher in City A than in City B; yet the overall rate is higher in City B than in City A. These results arises because the percentage of deaths among people without health insurance is higher and there is a much higher percentage of such people in City B.
You might also like to view...
Solve the problem.Find the point on the line  that is closest to the point
A. 
B. 
C. 
D. 
Provide an appropriate response.Identify the numerical coefficient of the term 
A. 2
B. 
C. 
D. 1
Find x and y: -2x + y = 2; x - 3y = 6
a. 2 3 x = 4Ä y = -2Ä 5 5 b. 4 4 x = 2Ä y = -2Ä 5 5 c. 2 4 x = -2Ä y = -2Ä 5 5 d. 4 2 x = -2Ä y = -2Ä 5 5 e. 2 4 x = 2Ä y = 2Ä 5 5
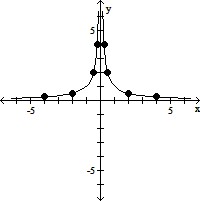
Graph the equation by plotting points.y = 
A. 
B. 
C. 
D.