Graph the equation using the slope and y-intercept.y = -  x
x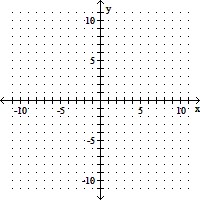
A. 
B. 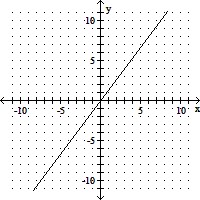
C. 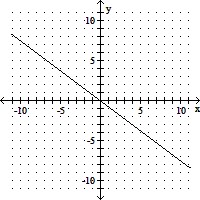
D. 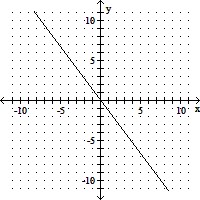
Answer: C
You might also like to view...
Graph the rational function.y = 
A. 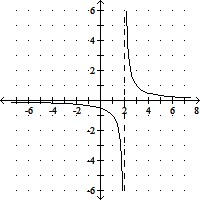
B. 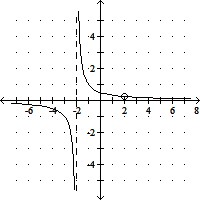
C. 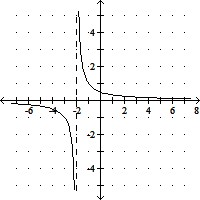
D. 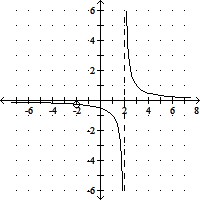
Graph the function by starting with the graph of the basic function and then using the techniques of shifting, compressing, stretching, and/or reflecting.f(x) = (-x)2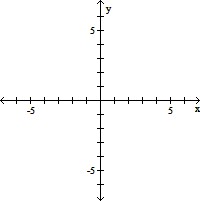
A. 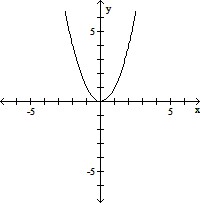
B. 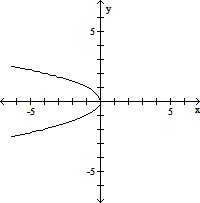
C. 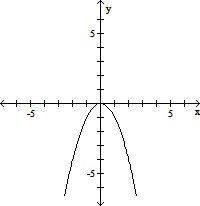
D. 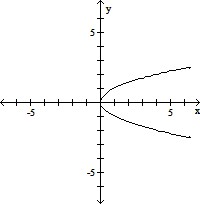
Solve.The strawberry yield (in bushels per acre) for a farm in Springfield from 1996 through 1998 is given by the equation  In this equation, x = 0 represents the year 1997. Assume this trend continues and predict the year in which the Springfield farm's strawberry yield will be 177 bushels per acre.
A. 2003 B. 2004 C. 2002 D. 2005
Let f be a function with the given domain and range. Find the domain and range of the indicated function.Domain of f(x): [-3, 4]; Range of f(x): [0, 4] 6f(x + 2)
A. D: [-5, 2]; R: [6, 10] B. D: [-1, 6]; R: [0, 24] C. D: [-1, 6]; R: [6, 10] D. D: [-5, 2]; R: [0, 24]