Suppose that the average adult in the United States will work x number of days (rounded to the nearest day) to earn enough to pay for all of the household's leisure activities in that year. This number can be calculated by multiplying the average percent of household income spent on leisure activities by 365 (the number of days in a year). The bar graph shows the percent of income spent in various countries of the world. Use the graph to answer the question.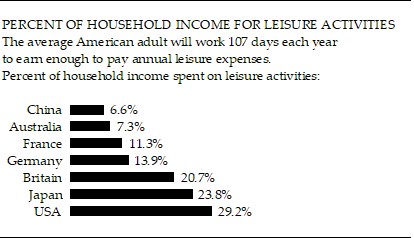 In which country is the lowest percent of income spent on leisure activities? What percent is this?
A. China; 6.6%
B. USA; 70.8%
C. China; 93.4%
D. Australia; 7.3%
Answer: A
Mathematics
You might also like to view...
Multiply.(5 + 6)2
+ 6)2
A. 239 + 60
B. 311 - 60
C. 281 + 60
D. 311 + 60
Mathematics
Graph the parabola and label the vertex. Find the x-intercept.x = -2(y + 3)2 - 1
A. vertex (-1, -3), x-intercept (17, 0)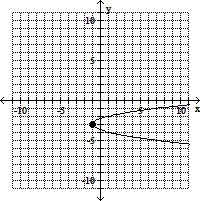
B. vertex (1, -3), x-intercept (-19, 0)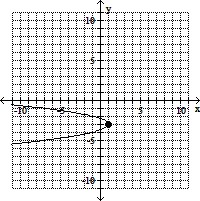
C. vertex (1, -3), x-intercept (19, 0)
D. vertex (-1, -3), x-intercept (-17, 0)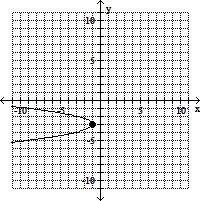
Mathematics
Solve the problem.Brad invests $7100 in an account paying 15% APR compounded monthly. How much is in the account after 17 months?
A. $76,404.97 B. $8654.60 C. $7226.06 D. $8769.48
Mathematics
Add.(12x2 + 11x - 8) + (22x + 8)
A. 12x2 + 11x + 16 B. 12x2 + 33x - 16 C. 12x2 + 33x D. 45x3
Mathematics