The following table shows the approximate average household income in the U.S. in 1990, 2002, and 2003. ( represents 1990.)
t (Year)
0
12
13
H (Household Income in $1000)
30
42
43
?
Which of the following kinds of models would best fit the given data? (A, a, b, c, and m are constants.)
?
A. Exponential: 
B. Logarithmic: 
C. Linear: 
D. Quadratic: 
E. Power: 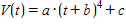
Answer: C
Mathematics
You might also like to view...
Solve the problem.Find the volume of the region bounded by the coordinate planes, the parabolic cylinder  , and the plane
  .
.
A. 432 B. 162 C. 144 D. 324
Mathematics
Solve the radical equation. -
-  = 3
= 3
A. {2} B. {3, 8} C. {2, 38} D. {-2}
Mathematics
Draw the angle in standard position.-120°
A. 
B. 
C. 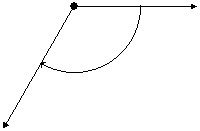
D. 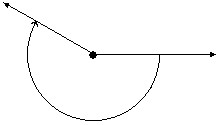
Mathematics
Solve the problem.There are currently 53 million cars in a certain country, decreasing by 1.7% annually. How many years will it take for this country to have 39 million cars? (Round to the nearest year.)
A. 8 yr B. 155 yr C. 4 yr D. 18 yr
Mathematics