Exhibit 7-2 Cost schedule for pizza production
Pizzas
LaborCost
EnergyCost
MaterialsCost
0
$10
$ 0
$ 0
1
10
12
4
2
24
22
8
3
40
30
12
4
60
36
16
5
90
40
20
Exhibit 7-2 shows the labor, energy, and materials cost of making various quantities of pizzas. The table shows that the labor cost of making pizzas will:
A. increase at a decreasing rate.
B. decrease at a decreasing rate.
C. decrease at an increasing rate.
D. increase at an increasing rate.
Answer: D
You might also like to view...
Consumer preferences
a. do not vary from one consumer to another b. have little to do with personal tastes and income c. are not influenced by the utility of goods d. are individual evaluations of goods and services e. can be objectively measured and compared across individuals
Job losers typically account for ____ of the unemployed
a. 80 to 90 percent b. 50 to 60 percent c. 30 to 40 percent d. 10 to 20 percent
Using the figure as a guide, which of the following is FALSE with respect to profit maximization and the monopolist? 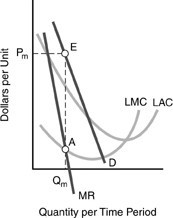
A. Profits are the positive difference between total revenues and total costs. B. A monopolist (like any other firm) will select an output rate at which marginal revenue is equal to marginal cost, at the intersection of the marginal revenue curve and the marginal cost curve. C. The monopolist will produce quantity Qm and charge a price of Pm. D. When compared to a competitive situation, consumers pay a higher price to the monopolist, and consequently are forced to purchase more of a product as price varies directly with quantity demanded.
The additional revenue associated with hiring one additional unit of some factor input, such as labor, is called
A. marginal factor cost. B. marginal cost. C. marginal revenue product. D. marginal physical product.