Refer to Figure 9-8. Suppose the U.S. government imposes a $0.25 per pound tariff on rice imports. Figure 9-8 shows the demand and supply curves for rice and the impact of this tariff. Use the figure to answer questions a-i
a. Following the imposition of the tariff, what is the price that domestic consumers must now pay and what is the quantity purchased?
b. Calculate the value of consumer surplus with the tariff in place.
c. What is the quantity supplied by domestic rice growers with the tariff in place?
d. Calculate the value of producer surplus received by U.S. rice growers with the tariff in place.
e. What is the quantity of rice imported with the tariff in place?
f. What is the amount of tariff revenue collected by the government?
g. The tariff has reduced consumer surplus. Calculate the loss in consumer surplus due to the tariff.
h. What portion of the consumer surplus loss is redistributed to domestic producers? To the government?
i. Calculate the deadweight loss due to the tariff.
a. Price = $1.00 per pound; Quantity purchased = 16 million pounds
b. Consumer surplus = 1/2 × 16 million × $1 = $8 million
c. Quantity supplied by domestic producers = 8 million pounds
d. Producer surplus to rice growers = 1/2 × 8 million × $0.75 = $3 million
e. Quantity imported = 8 million pounds
f. Tariff revenue collected by the government = $0.25 × 8 million = $2 million
g. Loss in consumer surplus due to the tariff = 16 million × $0.25 + 1/2 × 4 million × $0.25 = $4.5 million
h. Amount redistributed to domestic producers = 5 million × $0.25 + 1/2 × 3 million × $0.25 = $1.625 million
Amount redistributed to the government = 8 million × $0.25 = $2 million
i. Deadweight loss due to the tariff = 1/2 × 4 million × $0.25 + 1/2 × 3 million × $0.25 = $875,000
You might also like to view...
Today's U.S. dollar bills are "backed" by
A) nothing. B) Warren Buffet. C) barrels of oil. D) precious metals. E) U.S. Treasury Bonds.
Studies show that the demand curve for peas has shifted. Which of the following explanations would you reject first?
a. The price of string beans has changed. b. The demand for corn has changed. c. The demand for string beans has changed. d. The income of consumers has changed. e. The price of peas has changed.
From these figures we can conclude that
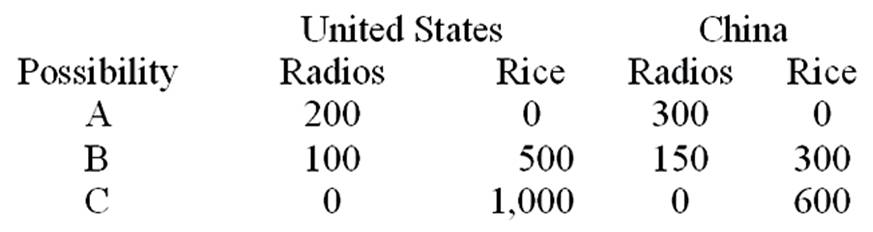
A. China has a comparative advantage in rice.
B. China has a comparative advantage in radios.
C. the United States has a comparative advantage in radios.
D. neither has a comparative advantage in these two goods.
A movement upward along the consumption function can be caused only by a(n)
A. increase in disposable income. B. decrease in disposable income. C. decrease in the price level. D. increase in the price level.