Find the indicated control limits.For a production process for which there is a great deal of data since its last modification, the population mean ? and the population standard deviation ? are assumed known. For such a process we have the following values for an  chart:central line = ?, UCL = ? + A?, LCL = ? - A?(The value A is found in the table of control chart factors). In a bottling factory, after bottling, the volume of juice in seven sample bottles is checked every 30 minutes. For this process,
  and
and
src="https://sciemce.com/media/4/ppg__text0425190836__f1q44g3.jpg" alt="" style="vertical-align: -4.0px;" /> Find the central line, UCL, and LCL for the mean.
A. 16.0, 16.019, 15.981
B. 16.0, 16.049, 15.951
C. 16.0, 16.045, 15.955
D. 16.0, 16.017, 15.983
Answer: C
Mathematics
src="https://sciemce.com/media/4/ppg__text0425190836__f1q44g3.jpg" alt="" style="vertical-align: -4.0px;" /> Find the central line, UCL, and LCL for the mean.
A. 16.0, 16.019, 15.981
B. 16.0, 16.049, 15.951
C. 16.0, 16.045, 15.955
D. 16.0, 16.017, 15.983
Answer: C
You might also like to view...
Write the Hindu-Arabic numeral for the given Babylonian numeral.
A. 3614 B. 3734 C. 314 D. 3674
Use the graph to complete the identity.cos 2x cos 5x + sin 2x sin 5x = ?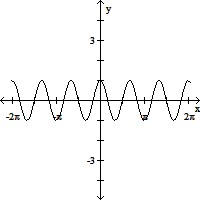
A. y = sin 3x B. y = sin 7x C. y = cos 3x D. y = cos 7x
Solve the problem.A cancer patient undergoing chemotherapy is injected with a particular drug. The function  gives the number of milligrams D of this drug that is in the patient's bloodstream h hours after the drug has been administered. How many milligrams of the drug were injected? To the nearest milligram, how much of the drug will be present after 2 hours?
Fill in the blank(s) with the appropriate word(s).
Find an equation in slope-intercept form for the nonvertical lines. Write the vertical lines in the form x = h.Passing through (-1, -4) and (-7, -9)
A. y =  x -
x - 
B. y = -  x +
x + 
C. y =  x +
x + 
D. y = -  x -
x - 