The amounts A (in billions of dollars) donated to support higher education in the United States from 2000 through 2007 are shown in the table, where t represents the year, with t = 0 corresponding to 2000.
Year, tAmount, A0
30.6
1
32.3
2
34.3
3
57.7
4
38.1
5
42.8
6
48
7
52.8
Use a graphing utility to create a scatter plot of the data.
A. ?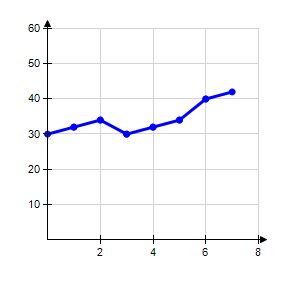
B. 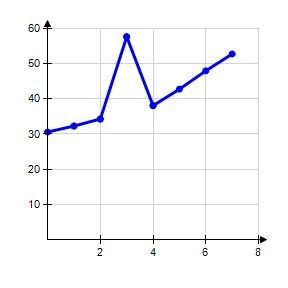
C. ?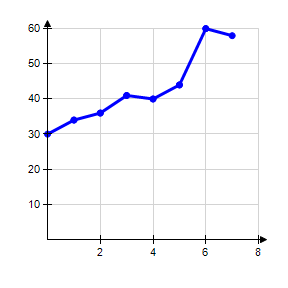
D. ?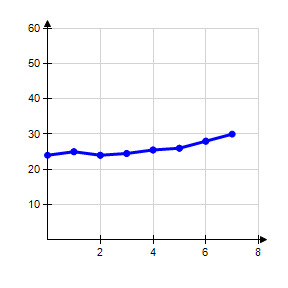
E. ?
Answer: B
You might also like to view...
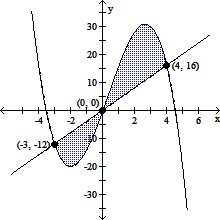
Find the area of the shaded region. f(x) = -x3 + x2 + 16x
A. 
B. - 
C. 
D. 
Find the missing values. Round amounts to the nearest dollar and rates to the nearest percent.Maturity value: $19,044Discount rate:  Date made:
  Due date: 9/9Time: 120 daysDiscount: $691Proceeds:
A. Discount rate: 9% Date made: 5/12 Proceeds: $19,044 B. Discount rate: 9% Date made: 5/12 Proceeds: $18,353 C. Discount rate: 11% Date made: 5/9 Proceeds: $18,353 D. Discount rate: 11% Date made: 5/12 Proceeds: $18,353
Find the volume of the solid. When necessary, use 3.14 as the approximate value of ?, and round as instructed.A cone with height 9 in. and radius 3 in. Round to the nearest whole number.
A. 127 in.3 B. 57 in.3 C. 85 in.3 D. 170 in.3
Solve.2r + 10 = 16
A. 8 B. 3 C. 4 D. 2