Solve the problem.The following table shows the sales generated by the transportation industry, in billions of dollars, in Country Y from 1993 through 1997. Predict the sales generated by the transportation industry in 2003 by using regression to find a quadratic function that fits the data. (Round answer to the nearest ten.)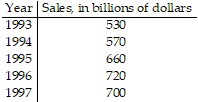
A. 360
B. 380
C. 370
D. 230
Answer: A
Mathematics
You might also like to view...
Express the sum using summation notation. Use 1 as the lower limit of summation and i for the index of summation.3 + 6 + 9 + . . . + 18
A. 
B. 
C. 
D. 
Mathematics
Solve the inequality. Give the solution set in both interval and graph forms.-5(x - 2) - 2x < 1(-5x + 8) - 3x
A. (2, ?)![]()
B. (-?, -2)![]()
C. (-2, ?)![]()
D. (-?, 2)![]()
Mathematics
Use algebraic and/or graphical methods to solve the inequality.(x + 7)(x + 6)(x - 5) < 0
A. x < -6 B. -7 < x < -6 or x > 5 C. x > 5 D. x < -7 or -6 < x < 5
Mathematics
Solve the problem.Explain the error in the problem:  and give the correct answer.
What will be an ideal response?
Mathematics