The demand curve is a graphic representation of:
a. the relationship between price and quantity supplied of a certain good or service.
b. the relationship between price and quantity demanded of a certain good or service.
c. the relationship between supply and demand for a certain good or service.
d. the relationship between productivity and quantity demanded of a certain good or service.
b. the relationship between price and quantity demanded of a certain good or service.
You might also like to view...
Suppose when a market has four firms, average economic profit is $1,000 per month. When the market has five firms, the average economic profit is -$50 per month. This suggests that
A) the long-run equilibrium number of firms is between four and five. B) the long-run equilibrium number of firms is four. C) the long-run equilibrium number of firms is five. D) there is no long-run equilibrium in this market as profits can never be zero.
Coins were minted with serrated edges: a. to make it obvious that they were made of cheap alloys. b. so that cheaper metals did not have to be used
c. to allow words to be printed on the border. d. to prevent the coins from being clipped. e. to make them jingle less when they rub together.
While credit cards like Visa are convenient instruments to use in exchange, they are not actually money
Indicate whether the statement is true or false
Refer to Figure 8.2. Which graph illustrates an output expansion path with a constant capital-labor ratio?
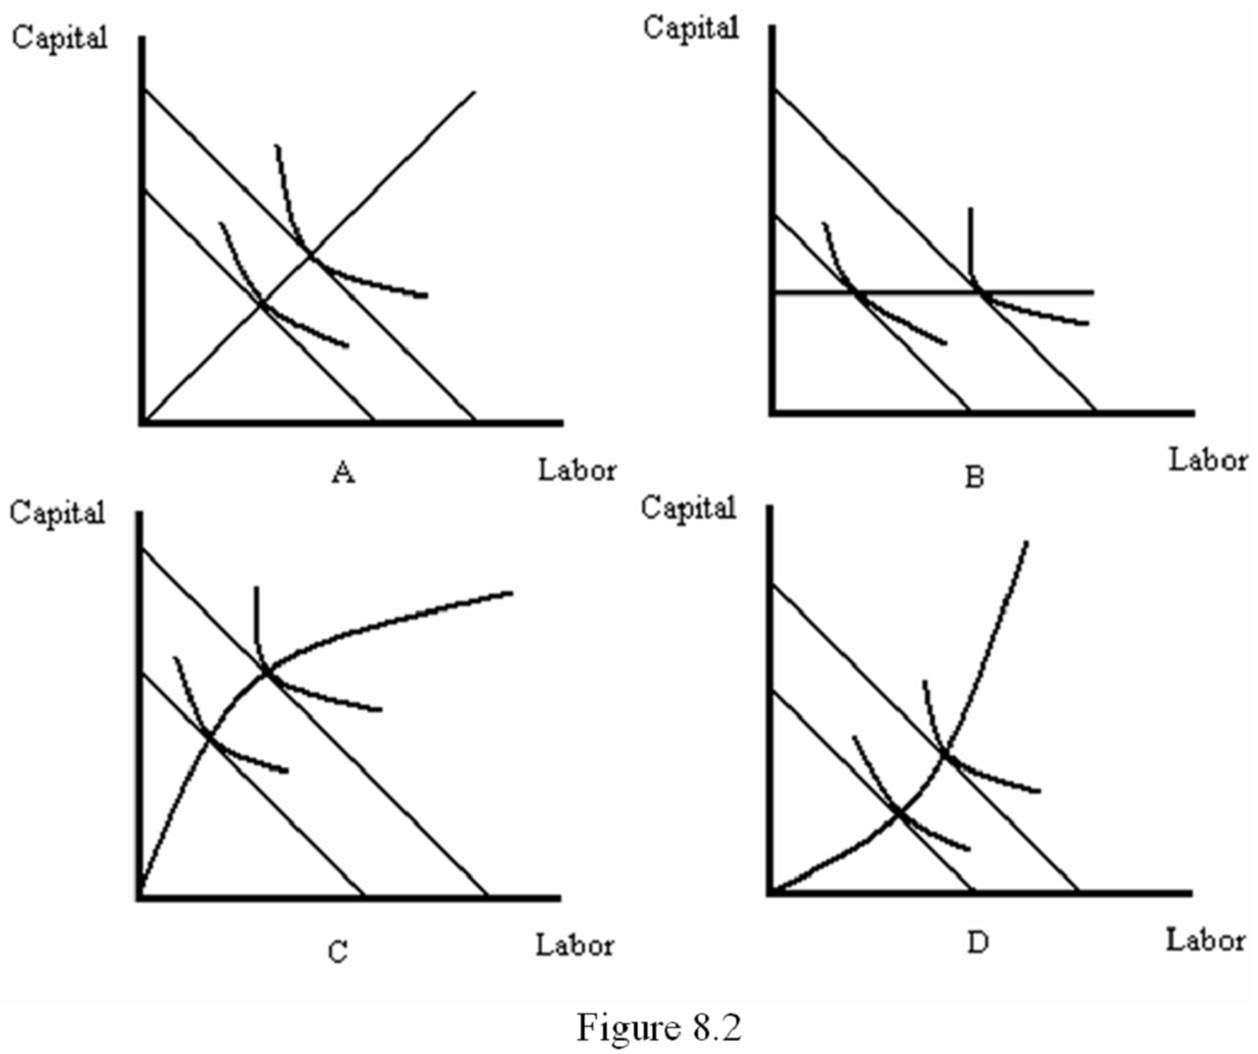
A. A
B. B
C. C
D. D