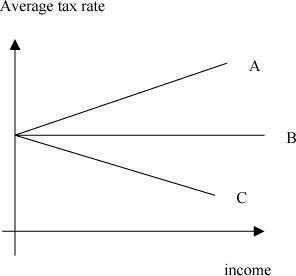
 Using the above figure, which of the lines in the above diagram represents a regressive tax?
A. A
B. B
C. C
D. none of them
Answer: C
You might also like to view...
In perfect competition, the price of the product is determined where the market
A) elasticity of supply equals the market elasticity of demand. B) supply curve and market demand curve intersect. C) average variable cost equals the market average total cost. D) fixed cost is zero.
The percentage of total national income spent on health care in the United States has
A) declined rapidly since 1965. B) remained below the level of inflation. C) risen steadily since 1965. D) remained constant over the last few years.
The multiplier is equal to
a. the reciprocal of MPC. b. the reciprocal of MPS. c. MPC + MPS. d. MPC/MPS.
In order to enjoy a rising standard of living standard, a nation's capital stock must grow faster than
a. the rate of depreciation b. the rate of inflation c. its population d. its financial assets e. its overall rate of economic growth