 The above figure presents the view of the economy according to
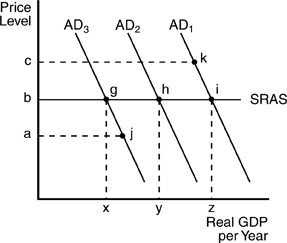
A. Ricardian economics.
B. Keynesian economics.
C. microanalysis.
D. classical economics.
Answer: B
You might also like to view...
Sam buys gasoline and coffee each week. In order to draw his budget line between gasoline and coffee, Sam would have to know
A) only how much income he has available to spend on gasoline and coffee. B) only the prices of one gallon of gasoline and one pound of coffee. C) only how much gasoline he wants to buy and how much coffee he wants to drink. D) both how much income he has to spend and the prices of one gallon of gasoline and one pound of coffee.
The cross elasticity of demand for good A with respect to good B is 0.2 . A 10 percent change in the price of good B will lead to a ____ percent change in the quantity of good A demanded. Goods A and B are _______
A. 2; substitutes B. 0.5; complements C. ?2; complements D. ?0.5; substitutes
If Bart has budget constraint A in the graph shown, what would cause his budget constraint to shift to B?
This graph shows three different budget constraints: A, B, and C.
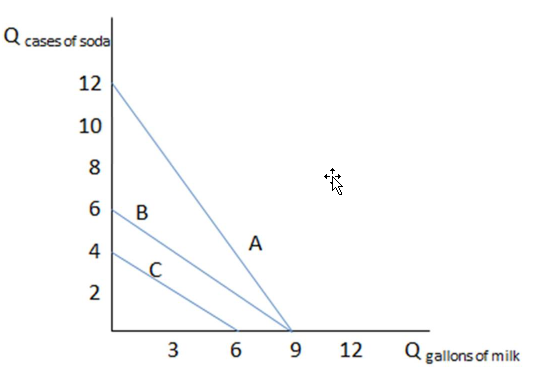
A. Bart's income has decreased.
B. The price of soda has increased.
C. The price of soda has decreased.
D. The price of milk has increased.
The current percentage of Americans over the age of 65 is
A. 18.2%. B. 19.0%. C. 13.0%. D. 10.5%.