Of the collection of supply and demand diagrams in Figure 2.2, which one shows the result of a decrease in the number of sellers in the market for anything?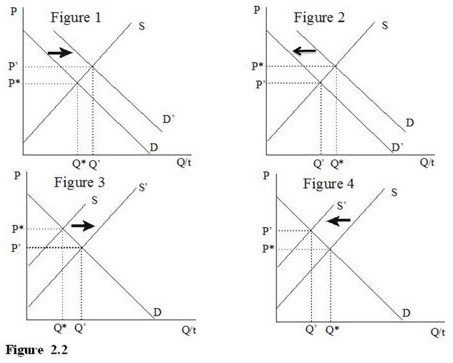
A. Figure 1
B. Figure 2
C. Figure 3
D. Figure 4
Answer: D
You might also like to view...
If the Fed sells U.S. government securities, the
A) money supply decreases, and the money supply curve shifts to the right. B) money supply decreases, and the money supply curve shifts to the left. C) money supply increases, and the money supply curve shifts to the left. D) money supply increases, and the money supply curve shifts to the right.
It takes __________ consecutive monthly changes in the LEI before a change in economic activity is being foreshadowed
A) two B) three C) four D) six
In the open-economy macroeconomic model, if the supply of loanable funds increases, then the interest rate
a. and the real exchange rate increase. b. and the real exchange rate decrease. c. increases and the real exchange rate decreases. d. decreases and the real exchange rate increases.
The supply curve for gasoline will be more elastic in:
A. the short run because of the principle of diminishing returns. B. the long run because of the principle of diminishing returns. C. the short run because firms have more time in which to respond to the price change. D. the long run because firms have more time in which to respond to the price change.