Graph.y = log3 x
A. 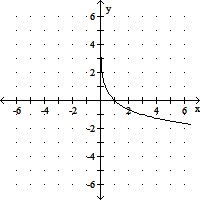
B. 
C. 
D. 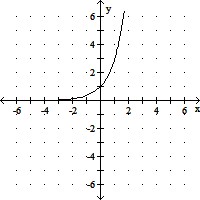
Answer: C
You might also like to view...
Solve the problem.The accompanying figure shows the graph of y = x2 shifted to a new position. Write the equation for the new graph.
A. y = x2 + 3 B. y = (x + 3)2 C. y = (x - 3)2 D. y = x2 - 3
This model is of the form f(x) = mx + b. Determine what m and b signify.The population, in millions, of a city t years after 1990 is given by 
A. 2.7 million is the population of the city in 1990 and 0.10 million is the decrease per year in the population . B. 0.10 million is the population of the city in 1990 and 2.7 million is the increase per year in the population . C. 2.7 million is the population of the city in 1991 and 2.8 million is the population in 1992. D. 2.7 million is the population of the city in 1990 and 0.10 million is the increase per year in the population .
Combine like terms when possible and write the polynomial in descending powers of the variable. Give the degree of the simplified polynomial. Decide whether the simplified polynomial is a monomial, a trinomial, or none of these.6x6 + 6x4 - 2x6
A. 10x4; 4; monomial B. 10x16; 16; monomial C. Cannot be simplified D. 4x6 + 6x4; 6; binomial
Identify the intercepts.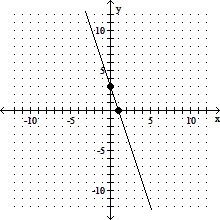
A. (1, 0), (0, 3) B. (-1, 0), (0, 3) C. (-3, 0), (0, 3) D. (1, 0), (0, -3)