Use the figure below to answer the following question.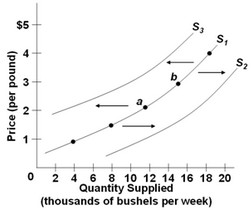 The figure above shows three supply curves for wheat. Which of the following would cause the supply of wheat to shift from S1 to S2?
A. an increase in the price of fertilizer
B. a change in consumer tastes away from wheat bread
C. the development of a more effective insecticide against cutworms
D. a decrease in consumer incomes, assuming wheat is a normal good
Answer: C
You might also like to view...
If an economy is allocatively efficient, it must be producing
A) beyond its production possibilities frontier. B) inside its production possibilities frontier. C) on its production possibilities frontier. D) the goods and services that are the most expensive. E) the goods and services that are the least expensive to produce.
The table above gives the demand schedule for lattes at the Bottomless Cu
A) 90 B) 30 C) 80 D) 60 E) 230
When a city licenses only 3 taxi firms to serve the market, the city has created a
A) cartel. B) legal monopoly. C) monopolistically competitive market. D) legal oligopoly. E) natural oligopoly.
Normative economics
A. does not depend on market interactions. B. only looks at the best parts of the economy. C. examines how the economy actually works (as opposed to how it should work). D. embodies value judgments.