The circle graph shows the results of the student council presidential election. The complete circular area represents 100% of the votes.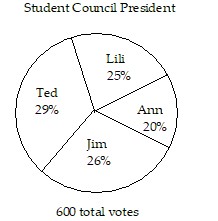 The circle graph shows what percent of the vote each person received.Who got the most votes?
A. Ann
B. Lili
C. Ted
D. Jim
Answer: C
Mathematics
You might also like to view...
Use an Euler diagram to determine whether the argument is valid or invalid. is less than 14.7 is less than 14. Therefore,
  is less than 7.
A. valid B. invalid
Mathematics
Find the domain of the function.f(x) =  - 2
- 2
A. {x|x < 2}, or (-?, 2) B. {x|x ? -2}, or (-?, -2) ? (-2, ?) C. {x|x ? 0}, or (-?, 0) ? (0, ?) D. all real numbers, or (-?, ?)
Mathematics
Multiply.(-30) ? (0) ? (-6) ? (3)
A. 0 B. 30 C. 1 D. -30
Mathematics
Add or subtract as indicated. Write the answer in lowest terms. -
- 
A. 
B. 
C. 
D. 
Mathematics