Solve the problem.The information in the chart below gives the salary of a person for the stated years. Model the data with a linear function using the points (1, 24,700) and  Then use this function to predict the salary for the year 2005.
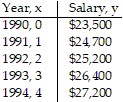
A. $36,250
B. $36,270
C. $36,230
D. $36,290
Answer: A
You might also like to view...
Describe the graph of the polar equation. r2sin 2? = 50
A. Hyperbola with the x- and y-axes as asymptotes B. Hyperbola with asymptotes y = ±25x C. Parabola centered at the origin opening to the right D. Parabola centered at the origin opening upward
Solve the problem.The relationship between the number of units sold by a company and the profit is linear. If 5 units sold results in $110 profit and 37 units sold results in $814 profit, find the marginal profit.
A. $22 per unit B. -$22 per unit C. $44 per unit D. $11.00 per unit
Express the interval in set builder notation and graph the interval on a number line.(-?, 4.5)![]()
A. { x ? 4.5}
![]()
B. { x ? 4.5}
![]()
C. { x > 4.5}
![]()
D. { x < 4.5}
![]()
Write the fraction in decimal notation.
A. 3.25 B. 3.15 C. 3.125 D. 2.75