Use the information given to draw a bar graph. Clearly label the bars. The following table shows the number of visitors at a jazz festival in various years. Make a vertical bar graph to illustrate the data. 
What will be an ideal response?
Answers may vary. The following is a possible answer.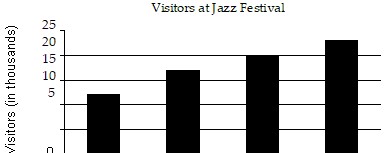
You might also like to view...
A statement is made about correlation. State whether the correlation is positive or negative and whether the correlation is most likely due to coincidence, a common underlying cause, or a direct cause.When gasoline prices fall, the number of cars on the freeways increases.
A. Negative correlation; common underlying cause B. Positive correlation; common underlying cause C. Positive correlation; direct cause D. Negative correlation; direct cause
Find the special products using patterns.(3p + 2)(3p - 2)
A. 9p2 - 12p - 4 B. 9p2 - 4 C. p2 - 4 D. 9p2 + 12p - 4
For the given pair of functions, find the requested item.Given f(x) = 5x - 3 and g(x) = -9x + 9, find (f - g)(x).
A. 14x - 12 B. -4x2 + 12 C. 14x + 12 D. -4x - 6
Solve the problem.A caterer uses special stacking ovens to prepare large amounts of food. Find the total number of servings that can be prepared in one hour.Pizza: 4 servings per panNumber of pans per oven: 6Pan changes per hour: 4Number of ovens: 3
A. 96 servings B. 288 servings C. 72 servings D. 238 servings