Match the graph to the correct inequality.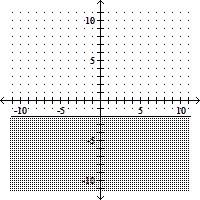
A. x ? -2
B. y ? -2
C. x ? -2
D. y ? -2
Answer: B
You might also like to view...
Find the center of mass of a thin plate covering the given region with the given density function.The region bounded below by the parabola  and above by the line
  , with density
A.  =
=  ,
,  =
= 
B.  =
=  ,
,  =
= 
C.  =
=  ,
,  =
= 
D.  =
=  ,
,  =
= 
Use a graphing calculator to graph the equation and identify the x-intercepts. If your answers are not exact, round to the nearest tenth.y = -2.5x2 + 8.9x - 1.5
A. x-intercepts: (-3.7, 0) and (0.2, 0)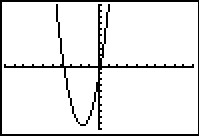
B. x-intercepts: (0.2, 0) and (3.4, 0)
C. x-intercept: (1.8, 6.4)
D. x-intercept: (0, -1.5)
Use cross products to determine whether the pair of fractions is equivalent. and
and 
A. not equivalent B. equivalent
Tell whether a linear model or a quadratic model is appropriate for the data. If linear, tell whether the slope should be positive or negative. If quadratic, decide whether the leading coefficient a of x2 should be positive or negative.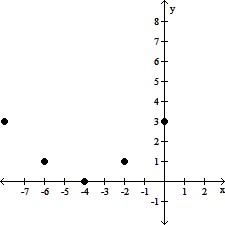
A. quadratic; positive B. quadratic; negative C. linear; negative D. linear; positive