The following graph shows average fixed costs, average variable costs, average total costs, and marginal costs of production.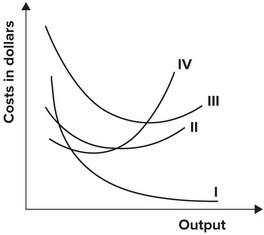 The average variable cost curve is represented by which curve?
A. I
B. II
C. III
D. IV
Answer: B
You might also like to view...
Which of the following is INCORRECT?
a. Aggregate abatement spending in the U.S. has increased over time b. Across all economic sectors, business spending on abatement in the United States comprises the highest proportion of aggregate abatement spending c. Across major industries, spending on waste treatment outweighs spending on recycling d. The petroleum and coal industry spends less on abatement than any other industry
If the real wage rises
A) firms will hire less labor. B) firms will hire additional labor. C) the marginal cost of labor falls. D) the marginal benefit of the worker increases.
The expansion of 2002 and beyond was due, at least in part to
a. interest rate increases. b. increases in housing wealth. c. increases in investment spending. d. large reductions in federal spending. e. increases in taxes.
Using the equation of exchange, if real output increases by 5 percent per year and velocity is stable, in order to keep the price level stable
A. The interest rate must increase by 5 percent per year. B. The money supply must increase by more than 5 percent per year because nominal output is greater than 5 percent. C. The money supply must increase by 5 percent per year. D. Velocity must increase by 5 percent per year.