Solve the problem.The following data represents the number of employees at a company at the start of each year since the company began. 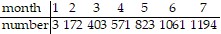 Find the slope of the line of best fit for the data set and interpret it.
What will be an ideal response?
The slope is about 206.1 which means that the number of employees is increasing by about 206 employees each year.
Mathematics
You might also like to view...
Perform the indicated operations.4 2
2
A. 256x2 - 640x + 400 B. 64x2 - 160x + 100 C. 64x2 + 100 D. 64x2 - 40x + 25
Mathematics
Find the area under the normal curve for the condition.Find the percent of the total area under the curve between z = -2.36 and z = -0.14.
A. 43.5% B. 43.1% C. 43.4% D. 43.9%
Mathematics
What can you say about point of inflation for  ?
?
Select the correct answer. a. point of inflation gets closer to ±6 b. point of inflation goes away from the origin c. point of inflation gets closer to the origin d. point of inflation goes away from ±3
Mathematics
Simplify.
A. 
B. 
C. 
D. 
Mathematics