The figure below represents the effects in the labor markets due to migration. Here, the world has been divided into a high-income "North" (left panel) and a low-income "South" (right panel). Dn and Sn are the labor demand and the labor supply curves in North. Ds and (Sr + Smig) are the labor demand and pre-migration labor supply curves in South. Sr is the post-migration labor supply curve in South. The value c is the cost of migrating.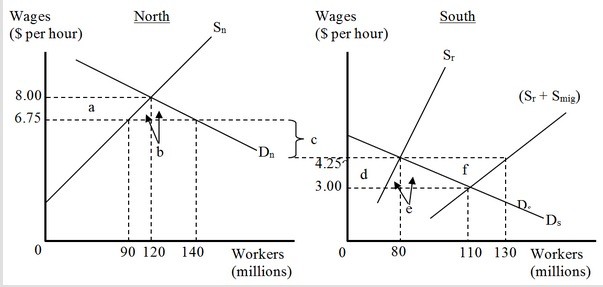 As a result of migration, the employers in North
A. gain $162.5 million.
B. lose $131.25 million.
C. lose $100 million.
D. gain $31.25 million.
Answer: A
You might also like to view...
If an economy maintains a small rate of growth for a long period of time, then the size of the economy:
A. can increase by a large amount. B. can only increase by a small amount. C. will stay nearly constant. D. can never double.
The law of demand states that
a. quantity demanded is inversely related to price b. quantity demanded is directly related to income c. marginal utility is inversely related to quantity consumed d. total revenue is directly related to price e. demand curves are linear
Which of the following best represents the effects of a decrease in the price of tomato juice, other things being equal?
a. An upward movement along the demand curve for tomato juice. b. A downward movement along the demand curve for tomato juice. c. A rightward shift in the demand curve for tomato juice. d. A leftward shift in the demand curve for tomato juice.
When a new firm enters a competitive price-searcher market, the demand curves faced by all existing firms in that market will
a. shift to the left. b. shift to the right. c. shift in a direction that is unpredictable without further information. d. remain unchanged. It is the supply curve that will shift.