The silverware industry has been in serious decline since the 1980s. Family dining habits are less formal so people purchase less silverware. Also, in 2006-2008, the price of silver increased from $5 to $20 per ounce. Which graph in Figure 4-12 best illustrates these developments?
a.
1
b.
2
c.
3
d.
4
Figure 4-12
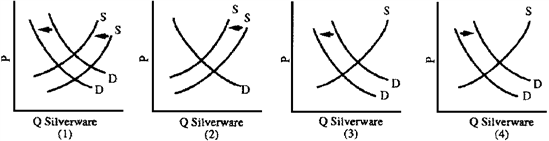
a
Economics
You might also like to view...
Unemployment normally arises when:
A) labor markets are frictionless. B) wages are above the market clearing wage level. C) wages are below the market clearing wage level. D) wages are equal to market clearing wage level.
Economics
A scatter plot:
A) is the same as a pie chart. B) shows how a variable changes across time. C) shows the relationship between two variables at a point in time. D) represents the frequency of a variable being observed.
Economics
The M2 money supply is represented by
A) M2 = × MB. B) M2 = × . C) MB = × M2. D) MB = × .
Economics
Under the binding price ceiling of $4, what would be the black market price?
A. $14 B. $12 C. $16 D. $10
Economics