Refer to the table, in which investment is in billions. Which of the following scenarios would be consistent with the occurrence of cyclical asymmetry?
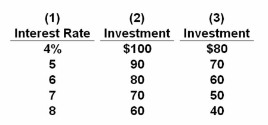
A. The Fed lowering the interest rate from 5 to 4 percent, while investment demand changes from columns (1) and (3) to columns (1) and (2).
B. The Fed raising the interest rate from 5 to 6 percent, while investment demand changes from columns (1) and (3) to columns (1) and (2).
C. The Fed lowering the interest rate from 7 to 6 percent, while investment demand changes from columns (1) and (2) to columns (1) and (3).
D. The Fed raising the interest rate from 7 to 8 percent, while investment demand changes
from columns (1) and (2) to columns (1) and (3).
C. The Fed lowering the interest rate from 7 to 6 percent, while investment demand changes from columns (1) and (2) to columns (1) and (3).
You might also like to view...
In the above figure, curve A is the ________ curve and curve B is the ________ curve
A) total variable cost; total fixed cost B) total cost; total fixed cost C) total fixed cost; total variable cost D) total cost; total variable cost E) total variable cost; total cost
The short-run aggregate supply curve will shift to the left if:
a. there is a significant increase in worker productivity. b. workers on fixed-wage contracts expect higher inflation. c. the price of raw materials decreases. d. the price of capital goods rises. e. wages fall in anticipation of higher prices.
A firm that is a monopolist in the output market and a monopsonist in the input market
A) will hire the same amount of labor as if perfect competition prevailed in both markets, but pay a lower wage. B) will restrict the level of output but not that of employment compared to the perfectly competitive case. C) will hire less labor but pay the same wage compared to the perfectly competitive case. D) will hire less labor and pay a lower wage compared to the perfectly competitive case.
An emission fee levied against polluting firms will tend to shift the:
A. Supply curve of the firms to the left B. Supply curve of the firms to the right C. Demand curve for the product to the left D. Demand curve for the product to the right