Figure 9-2
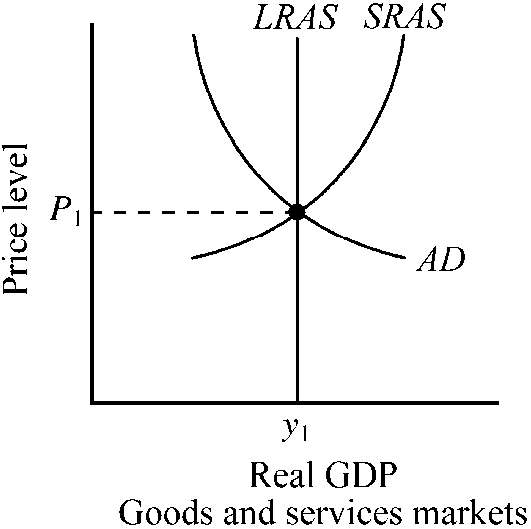
Which of the following is true for the economy depicted in ?
a.
Potential output exceeds y1.
b.
When output y1 is achieved, the actual rate of unemployment will exceed the natural rate of unemployment.
c.
When output y1 is achieved, the actual rate of unemployment will be less than the natural rate of unemployment.
d.
When output y1 is achieved, the actual rate of unemployment will equal the economy's natural rate of unemployment.
d
You might also like to view...
If a fishing boat owner brings 10,000 fish to market and the market price is $7 per fish, she will have $70,000 in total revenue. If the average variable cost of 10,000 fish is $4 and the fixed cost of the boat is $20,000 . what is her profit?
a. $1 b. $3 c. $1,000 d. $3,000 e. $10,000
The only factor that can cause movement along the aggregate supply curve is the
a. labor force. b. capital stock. c. availability of resources. d. price level. e. All of the above are correct.
Currencies that are not backed by precious metals of equal value are called:
a. Legal tender. b. "Trouble" – with a capital "T." c. Near money. d. Repurchase agreements. e. Fiat money.
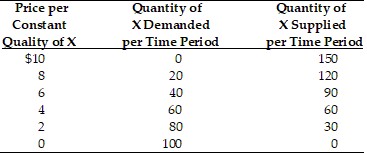 Given the market data for good X in the above table, an equilibrium quantity is established at
A. 30 units. B. 90 units. C. 60 units. D. 120 units.