First, rewrite each equation in exponential form. Then, use a table of coordinates and the exponential form to graph the logarithmic function. Begin by selecting -2, -1, 0, 1 and 2 for y. Finally, based on your graph, describe the shape of a scatter plot that can be modeled by f(x) = log b x, 0 < b < 1.y = log1/7 x
A. 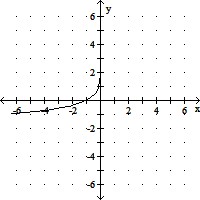
increasing
B. 
decreasing,
although rate of decrease is slowing down
C. 
increasing,
although rate of increase is slowing down
D. 
decreasing,
although rate of decrease is slowing down
Answer: D
You might also like to view...
Determine whether the number is divisible by 2, 3, 4, 5, 6, 7, 8, 9, and/or 10.4899
A. 2, 3, 9 B. 3, 9 C. 3 D. 9
Solve the problem.What is the range of the cosecant function?
A. all real numbers, except integral multiples of ?(180)° B. all real numbers C. all real numbers from -1 to 1, inclusive D. all real numbers greater than or equal to 1 or less than or equal to -1
Find an equation of the line containing the given pair of points and
and 
A. y =  x
x
B. y = -  x
x
C. y =  x +
x + 
D. y =  x -
x - 
Find an equivalent equation in polar coordinates.2x + 3y = 6
A. 2 sin ? + 3 cos ? = 6r B. r(2 sin ? + 3 cos ?) = 6 C. r(2 cos ? + 3 sin ?) = 6 D. 2 cos ? + 3 sin ? = 6r