The graph below shows estimated world population for the period 4000 BC - 2000 AD. Note that the logarithm of the world population and not actual population is plotted on the vertical axis. This means, for example, that when the graph reaches 7 on the vertical scale, world population is 107 and when the graph reaches 9 on the vertical scale, world population is 109. Log World Population 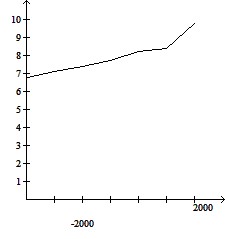 ? Year Use the graph to answer the question. How does world population in the year 1000 AD compare with world population in the year 2000 BC?
A. The 1000 AD population is roughly 14% larger than the 2000 BC population.
B. The 1000 AD population is roughly ten million larger than the 2000 BC population.
C. The 1000 AD population is roughly ten times as large as the 2000 BC population.
D. The 1000 AD population is roughly one million larger than the 2000 BC population.
Answer: C
You might also like to view...
Answer the question.How many automobile license plates can be made involving 2 letters followed by 4 digits?
A. 6,780,500 B. 6,760,000 C. 10,676 D. 6,749,744
Solve the system by using Gaussian elimination with backward substitution or by reducing the matrix to reduced-row echelon form. x + y + z = 14 x - y + 5z = 245x + y + z = 30
A. (5, 4, 5) B. No solution C. (4, 5, 5) D. (5, 5, 4)
Compute the average of the RRAM and LRAM approximations to estimate the area between the graph of the function and the x-axis over the given interval using the indicated number of subintervals. (The function is non-negative on the given interval).f(x) = x2 + 4 ; [0, 5] ; 5 subintervals
A. 67
B. 
C. 
D. 125
Subtract.735
A. 470 B. 990 C. 480 D. 380