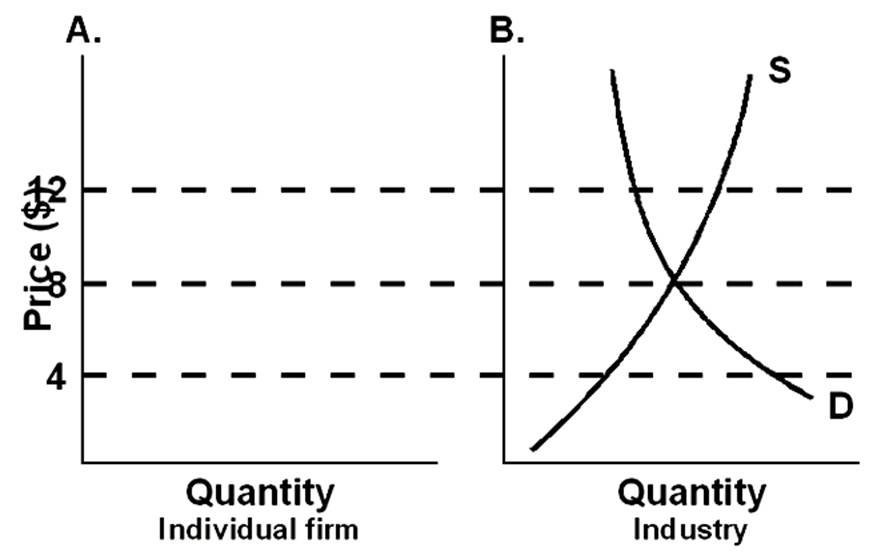
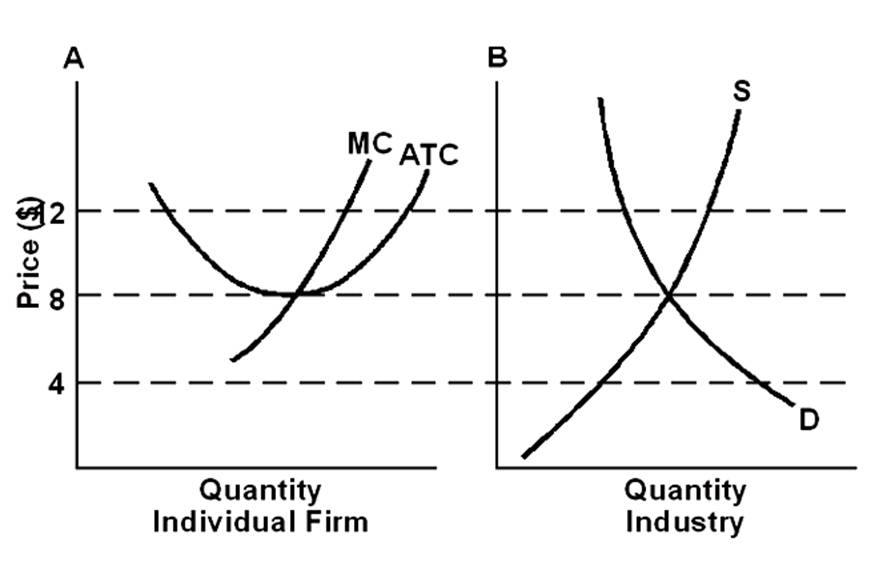
Given the industry supply and demand shown on the right side of the below graph, use the left side of the figure to draw the perfect competitor's demand, marginal revenue, average total cost, and marginal cost curves for its long-run situation.
Economics
You might also like to view...
The economy pictured in the figure has a(n) ________ gap with a short-run equilibrium combination of inflation and output indicated by point ________. 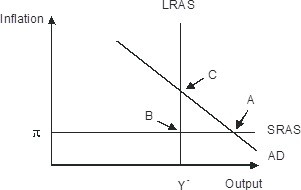
A. recessionary; A B. recessionary; C C. recessionary; B D. expansionary; A
Economics
In the above table, if the price of labor is $10 per hour and the price of capital is $20 per unit, what is the total cost of Technique W?
A) $80,000 B) $200,000 C) $280,000 D) $360,000
Economics
Barriers to free trade impair efficiency in the international allocation of resources.
Indicate whether the statement is true or false.
Economics
When would a profit-maximizing monopolist that operates with no government intervention choose to produce the competitive level of output?
What will be an ideal response?
Economics