The circle graph shows the results of the student council presidential election. The complete circular area represents 100% of the votes.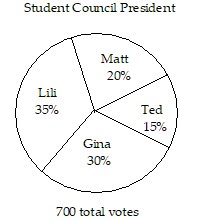 The circle graph shows what percent of the vote each person received.What percent of the votes did Ted NOT get?
A. 65%
B. 85%
C. 70%
D. 15%
Answer: B
Mathematics
You might also like to view...
Solve the problem.A projectile is fired vertically upward. Its distance s (in m) above the ground is given by  where t is the time
  . Find the acceleration of the projectile.
A. 9.8 m/s2 B. -4.9 m/s2 C. 389.2 m/s2 D. -9.8 m/s2
Mathematics
Find the Taylor series generated by f at x = a.f(x) = ex, a = 5
A. 
B. 
C. 
D. 
Mathematics
Use the given graph of f(x) = ax2 + bx + c to solve the specified inequality.f(x) > 0
A. no solution B. x < -4 C. -4 < x < 3 D. x < -4 or x > 3
Mathematics
Find an equation for the line with the given properties.Perpendicular to the line 6x - 7y = -32; containing the point (4, -1)
A. -7x + 6y = -32 B. 6x + 7y = -22 C. -7x - 6y = -22 D. -7x + 6y = -22
Mathematics