Refer to the figure below. This graph describes a good that: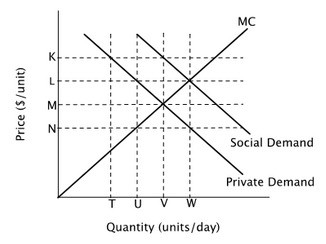
A. generates negative externalities.
B. the government should tax.
C. generates positive externalities.
D. should be banned.
Answer: A
You might also like to view...
In economics, money is defined as
a. the total value of one's assets in current prices. b. the total value of one's assets minus the total value of one's debts, in current prices. c. the total amount of salary, interest, and rental income earned during a year. d. any asset people generally accept in exchange for goods and services.
To derive a demand curve using utility analysis,
a. change a consumer's marginal utilities and note the effect of demand curve changes on market prices b. change a consumer's marginal utilities and note the effect of supply curve changes on market prices c. change a consumer's marginal utilities and note the effect of supply and demand curve changes on market prices d. note how the consumer's utility-maximizing consumption bundle changes in response to price changes e. note how the consumer's utility-maximizing consumption bundle changes in response to demand-curve shifts
Working as an elevator operator used to be a common job in the workforce decades ago, but today few jobs remain. The unemployment created by the introduction of automatic elevators would be considered:
A. cyclical. B. structural. C. frictional. D. wait.
Do economists tend to favor a system in which power plants buy and sell the right to pollute in the form of emission credits?
A. Yes; they encourage all firms to cut pollution by the same percentage. B. No; it is possible for some firms to do nothing if they simply buy enough credits. C. Yes; they believe that such a proposal would achieve a level of pollution reduction with the lowest cost to society. D. No; these programs are ineffective because they encourage major polluters to free ride on the efforts of others.