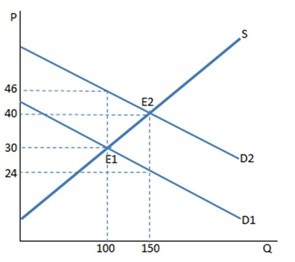
 The graph shown portrays a subsidy to buyers. The amount of money spent on this subsidy by the government is:
A. $2,400.
B. $3,600.
C. $800.
D. $6,000.
Answer: A
You might also like to view...
The cost of a one-unit increase in an activity
A) is called the total one-unit cost. B) is called the marginal cost. C) decreases as more of the activity is done. D) is called the marginal benefit/cost. E) is called the unit cost.
In the accelerator theory the
A) smaller the desired capital-output ratio the larger will be net investment. B) smaller the desired capital-output ratio the larger will be replacement investment. C) larger the desired capital-output ratio the larger will be net investment. D) larger the desired capital-output ratio the smaller will be replacement investment.
The largest source of federal government revenue is
a. corporate income taxes b. individual income taxes c. payroll taxes d. sales and excise taxes e. tariffs on imported goods and other customs fees and duties
The richest 10 percent of U.S. houses hold more than two-thirds of all wealth. The problem with this statement is that
A. it is based entirely on nonhuman wealth. B. it is based entirely on human wealth. C. it does not consider an individual's current income. D. it does not consider private and public pension plans.