The above figure shows three different supply-and-demand graphs. Which graph best represents the market for workers at your nearest fast-food restaurant?
A) Graph A
B) Graph B
C) Graph C
D) None of the above.
C
You might also like to view...
In the above table, if this is a perfectly competitive firm and the market price of the product is $8, what is the marginal revenue product of worker 3?
A) $96 B) $88 C) $80 D) $240
The demand curve for investment depicts:
a. an inverse relationship between interest rate and aggregate demand. b. an inverse relationship between interest rate and investment c. an inverse relationship between price level and real GDP. d. a direct relationship between interest rate and quantity of money. e. a direct relationship between aggregate demand and real GDP.
If the Fed’s monetary policy causes a substantial increase in interest rates, what is the most likely impact on velocity?
A. Velocity will decrease. B. Velocity will increase. C. Velocity will remain constant. D. Velocity is unrelated to interest rates.
Using Figure 1 above, if the aggregate demand curve shifts from AD1 to AD2 the result in the short run would be: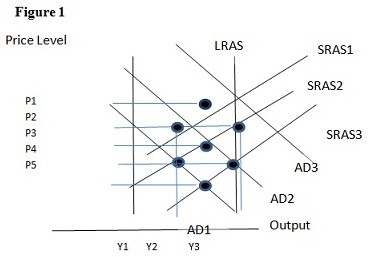
A. P1 and Y2. B. P3 and Y1. C. P2 and Y2. D. P2 and Y3.