The differential survival rates associated with birth weights in Figure 19-5 illustrate:
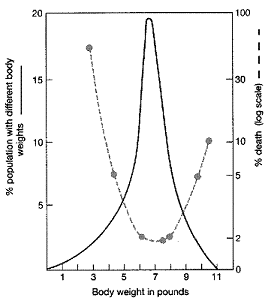
a. balanced polymorphism.
b. genetic drift.
c. neutral variation.
d. stabilizing selection.
e. disruptive selection
D
You might also like to view...
The negative logarithm of the hydrogen ion concentration in the solution is referred to as:
A. pH B. atomic mass C. -OH concentration D. electronegativity E. specific heat
Compare and contrast DNA and RNA
What will be an ideal response?
In a population of cattle, the following color distribution was noted: 36% red (RR), 48% roan (Rr), and 16% white (rr). This population is in a Hardy-Weinberg equilibrium. What will be the distribution of genotypes in the next generation if the
Hardy-Weinberg assumptions are met? A) 30% red; 60% roan; 10% white B) 40% red; 40% roan; 20% white C) 30% red; 50% roan; 20% white D) 36% red; 48% roan; 16% white
Many drugs that inhibit the synthesis of the cell wall act by
A. preventing the cross-linkage of NAM subunits. B. blocking the secretion of cell wall molecules from the cytoplasm. C. preventing the formation of alanine-alanine bridges. D. disrupting the formation of the mycolic acid layer of the cell wall. E. preventing the formation of ?-lactamases.