The graph below indicates the number of new cases of Chalk Dust Disease (CDD) diagnosed each month in the Mathland. Let T(t) represent the total number of new cases per month, F(t) the number of new cases per year among algebraists, G(t) the number of new cases per year among geometers, and t the number of years since January 1, 1990.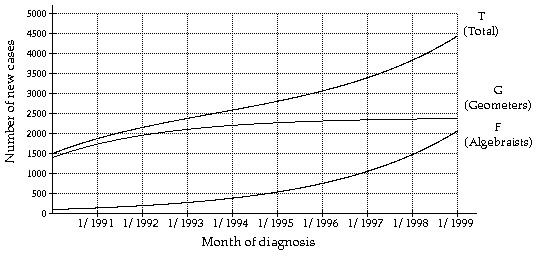 Estimate (T - G)(1) and interpret its meaning.
A. 1900; In January, 1991, there were about 1900 new cases of CDD diagnosed.
B. 1700; In January, 1991, there were about 1700 new cases of CDD diagnosed among geometers.
C. 140; In January, 1991, there were about 140 new cases of CDD diagnosed among geometers.
D. 140; In January, 1991, there were about 140 new cases of CDD diagnosed among algebraists.
Answer: D
You might also like to view...
Integrate the function.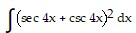
A. 2x +  tan2 4x -
  csc2 4x + C
B.  tan2 4x +
  csc2 4x + C
C.  tan 4x -
  cot 4x +
  ln
ln  + C
+ C
D. 2x -  tan2 4x -
  csc2 4x + C
Find the exact value of the following expression without using a calculator.sec(-?/2)
A. -1 B. 0 C. 1 D. Undefined
Use the given graph of f(x) = ax2 + bx + c to solve the specified inequality.f(x) ? 0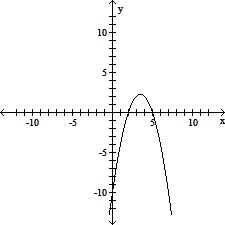
A. x ? 2 or x ? 5 B. 2 ? x ? 5 C. no solution D. x ? 2
Evaluate -x.x = -25
A. 0 B. 25 C. -25 D. -1