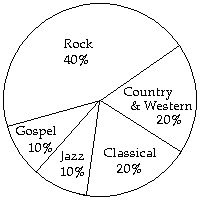
Describe the given distribution with a circle graph.A questionnaire was sent to customers asking about their music preferences. The customers were asked to pick the type of music they preferred from the categories rock, classical, gospel, country & western, and jazz. The results are shown in the table. Make a circle graph based on the data in the table.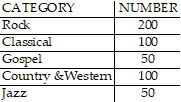
What will be an ideal response?
You might also like to view...
Find the exact value of the expression.sin 260° cos 20° - cos 260° sin 20°
A. - 
B. - 
C. 
D. - 
Provide an appropriate response.The date of repayment for a bond is called the maturity date.
A. True B. False
Suppose that the average adult in the United States will work x number of days (rounded to the nearest day) to earn enough to pay for all of the household's leisure activities in that year. This number can be calculated by multiplying the average percent of household income spent on leisure activities by 365 (the number of days in a year). The bar graph shows the percent of income spent in various countries of the world. Use the graph to answer the question.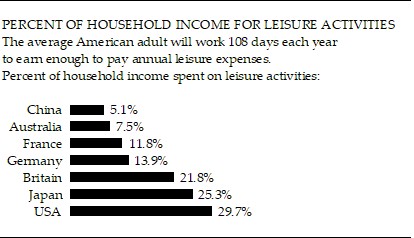 In which country is the highest percent of income spent on leisure activities? What percent is this?
A. Japan; 25.3% B. China; 94.9% C. USA; 29.7% D. USA; 70.3%
Identify the digit with the given place value.0.163135tenths
A. 0.1 B. 0 C. 5 D. 1