Graph the linear inequality.y ? 7 
A. 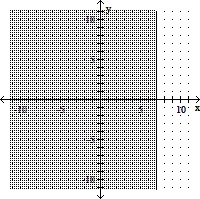
B. 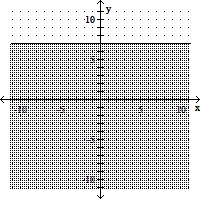
C. 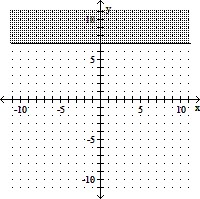
D. 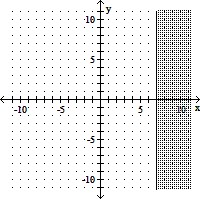
Answer: B
You might also like to view...
Find the sample standard deviation.15, 15, 15, 18, 21, 21, 21
A. 3 B. 7.7 C. 9.0 D. 2.8
Translate to an equation and solve.52 is 80% of what number?
A. 650 B. 65 C. 41.6 D. 6.5
Solve the problem.A school has just purchased new computer equipment for  The graph shows the depreciation of the equipment over 5 years. The point (0, 23,000) represents the purchase price and the point (5, 0) represents when the equipment will be replaced. Find and interpret the average rate of change in cost per year.
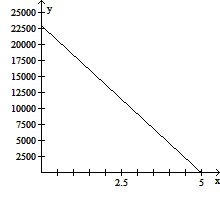
A. $4600 per year; the value of the equipment increases by $4600 per year during these years. B. -$23,000 per year; the value of the equipment decreases by $23,000 per year during these years. C. -$18,400 per year; the value of the equipment decreases by $18,400 per year during these years. D. - $4600 per year; the value of the equipment decreases by $4600 per year during these years.
Determine if the given ordered triple is a solution of the system.(3, -3, -4) x + y + z = -4 x - y + 3z = -64x + y + z = 5
A. solution B. not a solution