When plotting log wages (y-axis) against years of schooling (x-axis), the slope of the regression line indicates
A. the average wage.
B. the economic return to each additional year of schooling measured in dollars.
C. the average years of schooling.
D. the average logged wage.
E. the economic return to each additional year of schooling measured in percentage terms.
Answer: E
You might also like to view...
Which of the following statements best describes the union movement between 1800-1860?
a. Unions were composed primarily of craftsmen. b. Unions were concentrated primarily in rural towns and villages. c. Union membership grew consistently through the period and comprised a substantial portion of the working population. d. Women were more likely to belong to unions than men.
If a firm doubles all of its inputs and its output triples, it is said to be experiencing
a. diminishing marginal returns. b. increasing marginal returns. c. diseconomies of scale. d. economies of scale. e. constant average costs.
Refer to the information provided in Figure 3.11 below to answer the following question(s).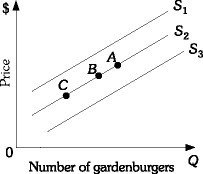 Figure 3.11Refer to Figure 3.11. An increase in quantity supplied is represented by a movement from
A. S2 to S1. B. Point B to Point C along supply curve S2. C. Point B to Point A along supply curve S2. D. S2 to S3.
The term "shock":
A. Always refers to an unexpectedly bad event B. Always refers to an increase in inflation C. Does not tell us whether what has happened is unexpectedly bad or unexpectedly good D. Always refers to a decrease in real GDP and an increase in unemployment