The above table has data from the nation of Atlantica. Based on these data, when disposable income equals 2.0 there is
A) dissavings of $3.0 trillion.
B) dissavings of $1.0 trillion.
C) savings of $1.0 trillion.
D) savings of $3.0 trillion.
E) dissavings of $5.0 trillion.
B
You might also like to view...
The figure above shows the cost, demand, and marginal revenue curves for a monopoly. The firm
A) will make an economic profit of $20. B) will charge a price of $10 per unit. C) will produce 20 units per day. D) is a natural monopoly.
Which of the following statements is true?
A) If the price of a good is raised and total revenue does not change, demand is perfectly elastic. B) If the price of a good is lowered and total revenue increases, demand is inelastic. C) If the price of a good is lowered and total revenue decreases, demand is elastic. D) If the price of a good is raised and total revenue increases, demand is inelastic.
Which of the following assets is best to hold in periods of high and expected inflation?
a. Cash. b. Checking account deposits. c. Land. d. Treasury Bills. e. Bonds.
The perfectly competitive firm represented in Figure 9-10 has a short-run supply curve that follows the
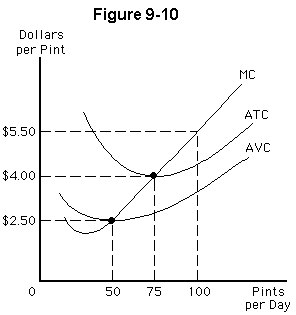
a.
marginal cost curve
b.
vertical axis for prices less than $4.00 and follows the marginal cost curve for prices above $4.00
c.
vertical axis for prices less than $2.50 and follows the marginal cost curve for prices above $2.50
d.
vertical axis for prices less than $5.50 and follows the marginal cost curve for prices above $5.50
e.
horizontal axis for quantities less than 50 and follows the marginal cost curve for quantities above 50