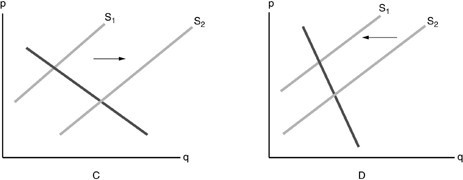
 Refer to the above figure. Which diagram shows the effect on the market of cellphones when the price of plastic has increased?
A. graph C
B. graph D
C. neither graph
D. both graphs
Answer: B
You might also like to view...
The farmer pays 20 cents for the seed that is sold to the miller for 35 cents;
A) $1 B) $2 C) $3 D) 35
The table above gives the production possibilities frontier for a nation that produces wheat and soybeans
Use the information in that table to complete the table below, which has in it the opportunity costs of moving from one production point to another. Do not forget to note the units of the opportunity costs. Movement from Opportunity cost Movement from Opportunity cost A to B D to C B to C C to B C to D B to A
The demand for Farm fresh brand apple juice is likely to be:
A. very price elastic, because there are many close substitutes available. B. less price elastic, because there are many close substitutes available. C. very price elastic, because the adjustment time is so fast. D. less price elastic, because the adjustment time is so slow. AACSB: Reflective Thinking
Diminishing marginal returns occurs:
A. only in the short run. B. both in the short run and the long run. C. only in the long run. D. only in time periods that are neither long run nor short run.