According to the graph shown, if this economy were to open to trade, domestic producers would increase:
This graph demonstrates the domestic demand and supply for a good, as well as the world price for that good.
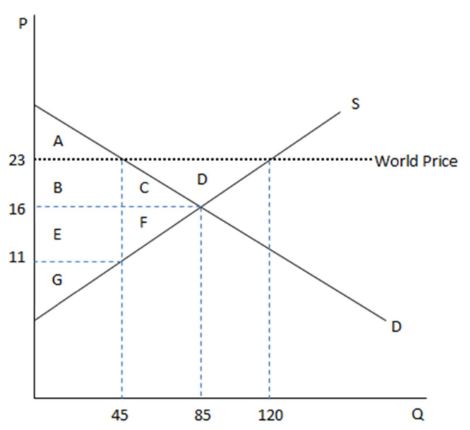
A. production by 75 units.
B. production by 35 units.
C. prices by $5.
D. prices by $11.
B. production by 35 units.
You might also like to view...
Worker mobility and transition aid to workers are two ways to offset some of the impacts of:
A. increasing wage inequality. B. increases in the labor supply. C. the slowdown in productivity growth. D. the slowdown in real-wage growth.
When tax revenues minus outlays is
i. positive, the government has a budget surplus. ii. negative, the government has a budget deficit. iii. zero, the government has a balanced budget. A) iii only B) ii and iii only C) i and ii only D) i only E) i, ii, and iii
The figure above shows Sam's budget line. The vertical intercept of Sam's budget line is equal to
A) the quantity of coffee purchased if zero gasoline is purchased. B) Pc/Y. C) the quantity of gasoline purchased if zero coffee is purchased. D) Pg/Y.
If the aggregate supply curve shifts leftward, then _____
a. the price level increases and output increases b. the resulting increase in the price level is usually called cost-push inflation c. the resulting increase in the price level is usually called demand-pull inflation d. the price level increases as long as the aggregate demand curve shifts rightward e. the price level decreases and output increases